
How are we all related?
The section on SNPs and Haplogroups describes what we know about the LSC in terms of SNPs. Breaking up the LSC attempts a similar breakdown of the LSC in terms of STR markers. The information available to each approach is a little different, but the final results are similar. In this section, we take a brief look at what a couple computer alogorithms can do with the haplotype data.
Relationships
Below, is an early diagram of our cluster generated by using the PHYLIP computer software. This software takes a matrix of the genetic distance between all the pairs of members of our cluster, and attempts to piece them together. In this diagram, time runs to the right. The separation between the vertical grey lines represents a duration of 10 generations, or about 250 years. Only men who were tested to 111-markers were used in this diagram.
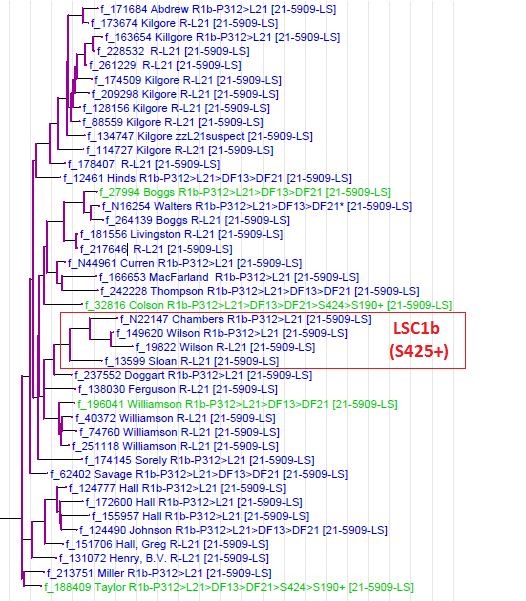
There are very large uncertainties in the estimates of the number of generations between each pair of men, and also in the estimates of the mutation rates used to calculate that number of generations. As a result, we can only draw very broad conclusions from the diagram.
- Based on testing done at ScotlandsDNA, all of the men in the diagram are likely S424+ and S190+. Reddin, who is not in the diagram is S424+, but S190-.
- The box in red highlights the names Sloan, Wilson and Chambers. In October of 2013, two SNPs were found that tie these men together, which confirms at least this aspect of the diagram.
- As can be seen, the "depth" of this diagram is about 4 or 5 grey lines or about 40-50 generations (1000-1250 years). This is the age of our most recent common ancestor (MRCA). It is important to keep in mind that this is a very rough estimate, likely only accurate within 500 years or so.
Below is an NJ diagram of the various men in our project. This diagram was generated by Steven Colson on Dec. 28, 2011. Only men who have had at least 67 markers tested have been included. Various family groups have been indicated, but not all of the men fall into such clear groups.
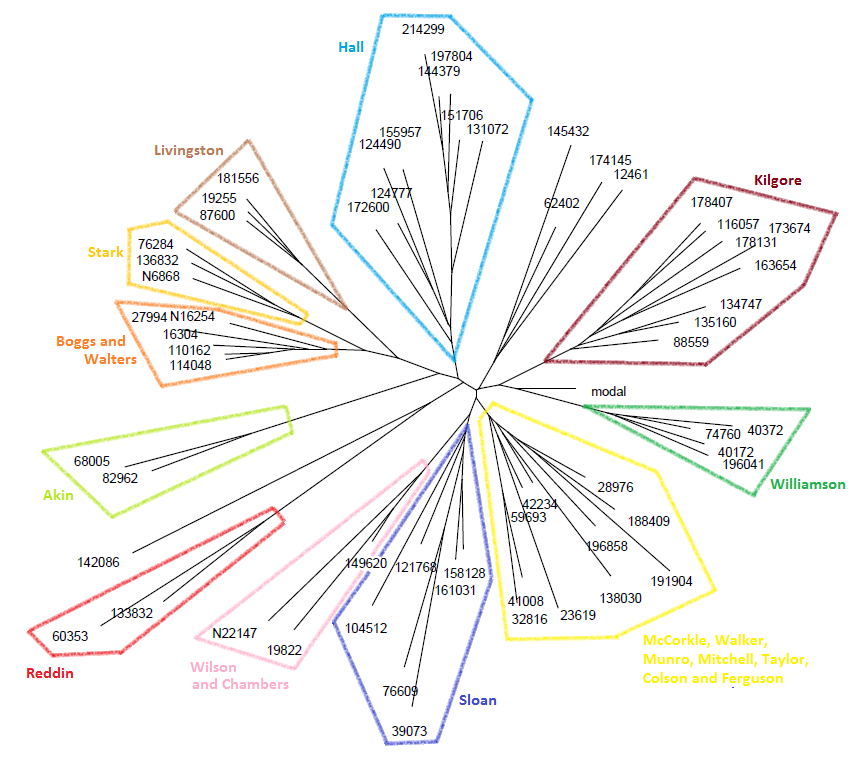
The yellow box in the lower right includes the surnames McCorkle, Walker, Munro, Mitchell, Taylor, Colson and Ferguson. The haplotypes for these men don't have much in common except for the fact that most of them have the value of 16 in their values for DYS464. Perhaps more structure will emerge for this group once more of them upgrade to 111-marker results.